
How to Read a USGS Hydrograph: Peak Discharge, Baseflow, and Lag Time
A practical guide to reading river hydrographs, understanding rising and falling limbs, and predicting how fast a river will crest after heavy rainfall.
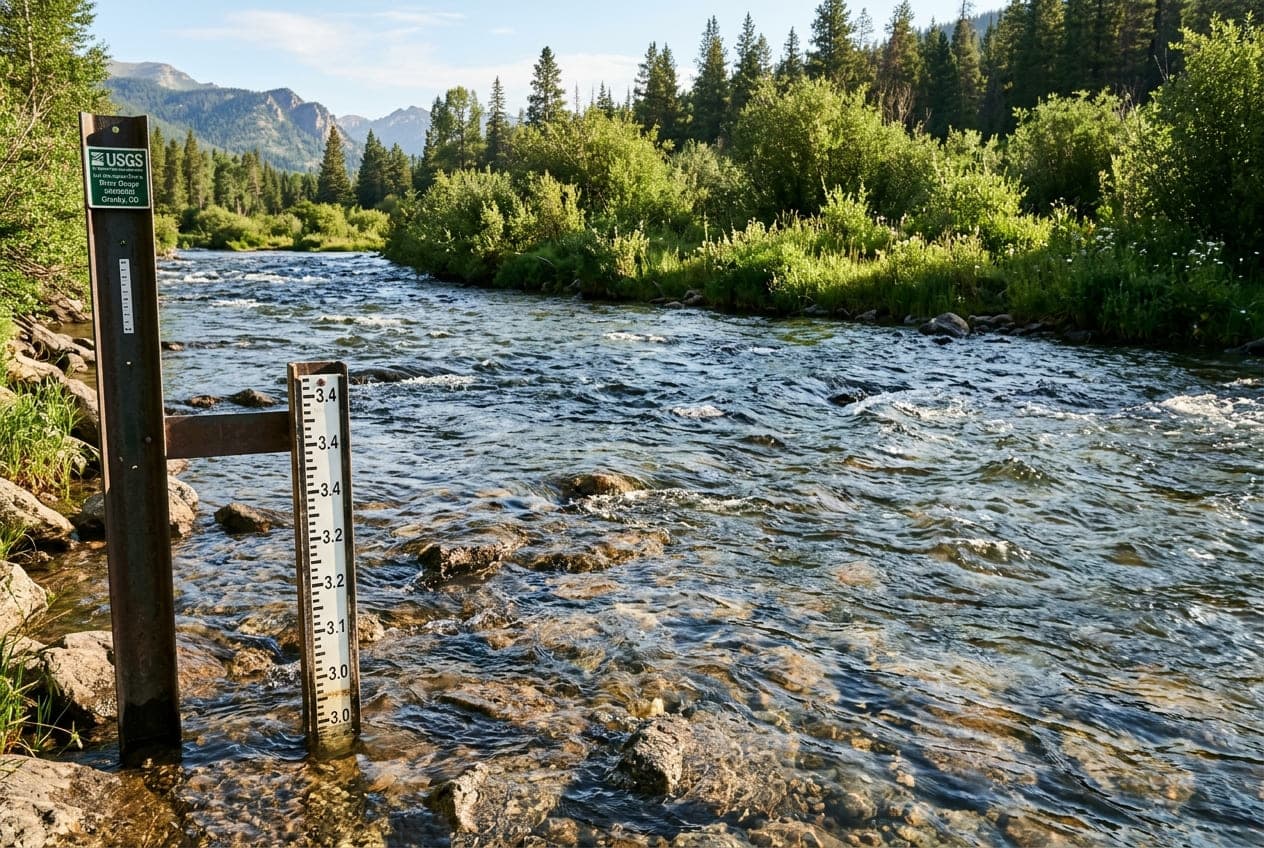
When evaluating river conditions, a single snapshot reading of CFS (cubic feet per second) tells you what the river is doing right now. But it doesn't tell you where the river is going next.
To understand the trajectory of a river, you need to read its hydrograph—the continuous graphical record showing streamflow over time.
Anatomical Components of a Hydrograph
A standard USGS streamflow hydrograph plots time (typically over a 7-day or 30-day window on the horizontal x-axis) against discharge in CFS or gauge height in feet (on the vertical y-axis).
A runoff hydrograph following a rain event has three primary phases:
1. The Baseflow Level
Before a storm begins, the river is sustained by baseflow—groundwater that slowly seeps into the stream channel through soil and subterranean aquifers. Baseflow creates the baseline, relatively flat line observed during dry weather.
2. The Rising Limb (Concentration Curve)
As precipitation falls over the watershed, water travels over land and through tributaries into the main stem of the river.
- A steep, nearly vertical rising limb indicates rapid runoff. This is common in steep mountainous terrain, urbanized watersheds with impermeable asphalt, or ground already saturated by previous storms.
- A gradual, shallow rising limb indicates a large watershed, permeable sandy soil, or heavy forest canopy that absorbs precipitation before it drains into the channel.
3. The Crest (Peak Discharge)
The crest represents the absolute maximum discharge recorded during the event. Once the peak passes, the river volume begins to diminish.
4. The Falling Limb (Recession Curve)
The falling limb reflects water leaving the watershed. Because water travels from the furthest headwaters and drains through groundwater pathways, the falling limb is almost always more gradual and prolonged than the rising limb.
Key Hydrological Concepts to Watch
Lag Time (Time to Peak)
Lag time is the delay between peak rainfall and peak river discharge.
- In small, steep creeks (flashy streams), lag time can be under 2 hours.
- In broad, low-gradient river basins (such as the Ohio or Lower Mississippi), lag time can stretch across multiple days or weeks.
Understanding your river's lag time helps you predict whether water levels will continue to surge hours after the rain has stopped.
Diurnal Fluctuations during Spring Melt
During snowmelt season (typically April through June in Western and Northern states), hydrographs display a distinct wavy saw-tooth pattern called a diurnal cycle:
- High mountain snow melts during the warmest hours of midday.
- Meltwater travels down high-elevation valleys, typically causing the gauge to peak in the late evening or early morning hours.
- Water recedes to daily minimums around midday before the next thermal pulse arrives.
Anglers and paddlers use these predictable cycles to plan their trips during favorable morning or midday water clarity windows.
Practical Interpretation for Outdoor Recreation
| Hydrograph Shape | What It Means | Recommendation |
|---|---|---|
| Steep Spike (Rising Limb) | Flash runoff in progress; heavy debris, muddy water, shifting currents. | High hazard. Avoid paddling or wading. |
| Broad Crest | Peak water volume reached; slow steady flow, high water levels stabilized. | Exercise extreme caution; riverbanks and strainers may still be submerged. |
| Gradual Descent (Falling Limb) | Watershed draining; water clarity improving, currents becoming predictable. | Prime conditions for fishing and downstream paddling. |
| Flat Horizontal Line | Stable baseflow conditions; predictable pool-and-riffle hydrology. | Reliable, consistent recreation. |
Conclusion
By checking not just the current reading but the last 48 to 72 hours of a USGS hydrograph, you can immediately identify whether water is rising dangerously, stabilizing, or clearing up for an optimal day on the water.
Want to see this in action? Check real-time river conditions near you.
Explore All Rivers →