
Understanding River Gage Datum: Absolute Elevation vs. Stage Height
Why a 5-foot gauge height doesn't mean the river is 5 feet deep. Exploring USGS gage datum, NGVD29, and NAVD88 vertical standards.
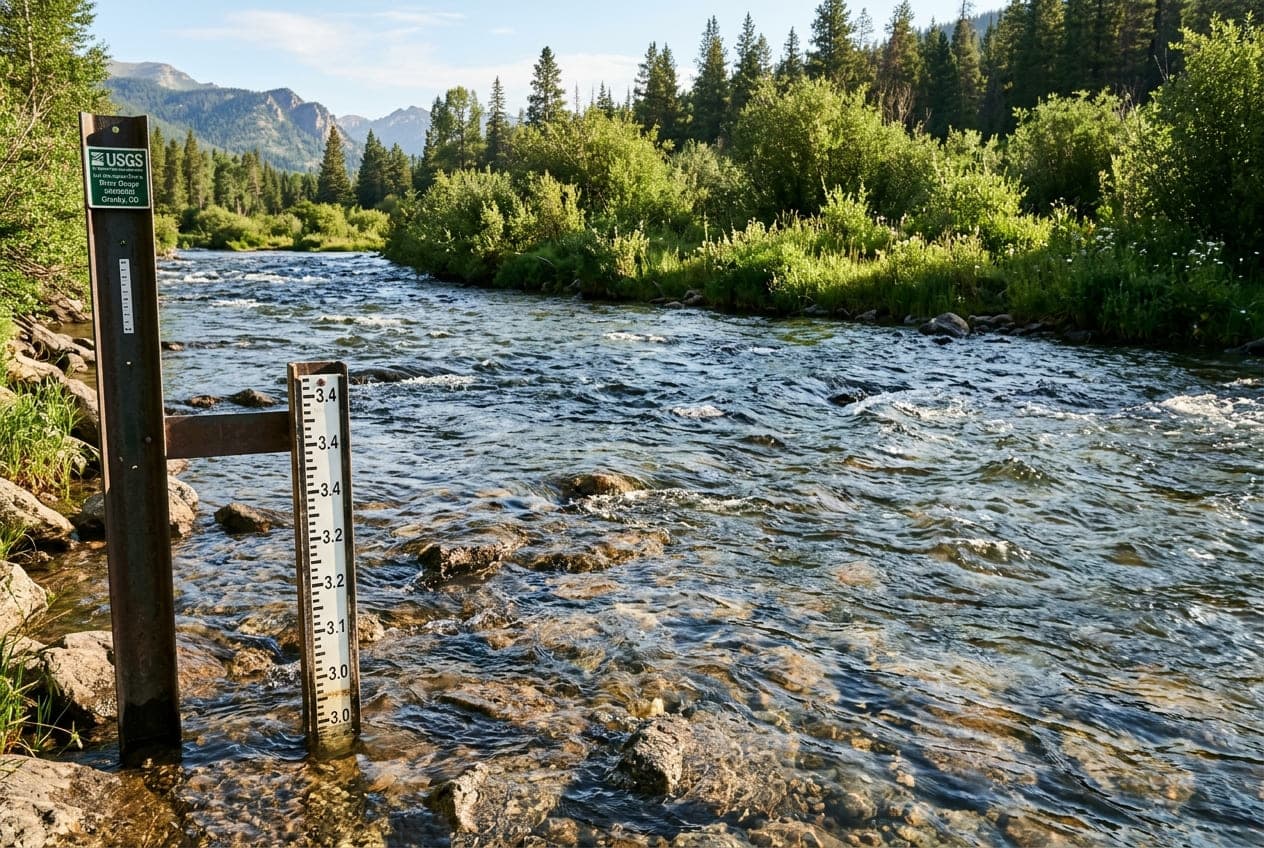
A common misconception among beginner paddlers and anglers is assuming that a USGS streamgage reading of "4.5 feet" means the river is four and a half feet deep.
In reality, river gauge height (also referred to as stage) has very little to do with the actual water depth under your boat.
To interpret gauge readings accurately, you need to understand Gage Datum—the mathematical baseline from which all river elevation measurements are calculated.
What is Gage Datum?
Every USGS monitoring station is assigned an arbitrary vertical baseline called the gage datum.
The datum is a fixed reference elevation established above an official vertical geodetic standard—most commonly the National Geodetic Vertical Datum of 1929 (NGVD29) or the North American Vertical Datum of 1988 (NAVD88).
When the USGS sets up a monitoring station, they intentionally position the zero-mark (0.00 ft) of the gauge lower than the lowest anticipated water level ever expected to occur in that channel.
An Illustrative Example:
Suppose a river gauge station is established on the Colorado River:
- The surveyed Gage Datum elevation is 4,215.00 feet above sea level.
- When the river's water surface elevation is 4,219.50 feet above sea level, the streamgage reports a Gage Height of 4.50 feet.
- However, the actual physical river channel under the gauge might be carved through a 15-foot deep canyon pool, or flowing across a 1-foot shallow bedrock shelf.
Therefore:
Water Surface Elevation = Gage Datum + Gage Height (Stage)
Why Gage Zero Does Not Mean Zero Water
Because the datum is positioned below normal baseflows, even during severe regional droughts the stage reading will usually remain positive (e.g., 1.2 feet).
In rare cases where deep channel erosion (scouring) lowers the river bottom over decades, or during unprecedented regional drought, a streamgage can actually report a negative stage (e.g., -0.15 ft). A negative reading does not mean the river is dry; it simply means the water level has dropped below the arbitrary datum established decades earlier!
Stage vs. Discharge: The Dynamic Rating Curve
Because natural river channels are irregular and subject to physical changes over time (such as sediment accumulation, gravel bar shifts, and bank erosion), a 5-foot stage reading in 1990 might have represented 1,200 CFS, while in 2026 that exact same 5-foot reading might represent 1,450 CFS.
To keep telemetry accurate, USGS hydrographers visit gauge sites multiple times per year. They use Acoustic Doppler Current Profilers (ADCPs) to measure cross-sectional velocity profiles and update the site's official Rating Curve.
The rating curve dynamically maps the continuous depth reading recorded by the pressure transducer or radar sensor into the accurate cubic feet per second (CFS) discharge figure.
Key Takeaways for River Users
- Relative, Not Absolute: Gage height is valuable because of how it changes relative to normal conditions—not because it tells you the absolute depth of the river.
- Consult Baseline Percentiles: A gauge height of 6 feet might indicate drought on one river and catastrophic flooding on another. Always look at the historical percentiles (such as ClearGauge's Low, Normal, High, and Flood categories) to put the number in context.
- Verify Channel Morphology: Just because a gauge reads high does not guarantee you won't scrape bottom in wide shallow braids upstream or downstream of the sensor location.
Want to see this in action? Check real-time river conditions near you.
Explore All Rivers →