
How Does the USGS Measure Streamflow? From Stilling Wells to Acoustic Doppler (ADCP)
Behind the science of river gauging: how USGS hydrographers convert water elevation into cubic feet per second (CFS) using rating curves and sonar technology.
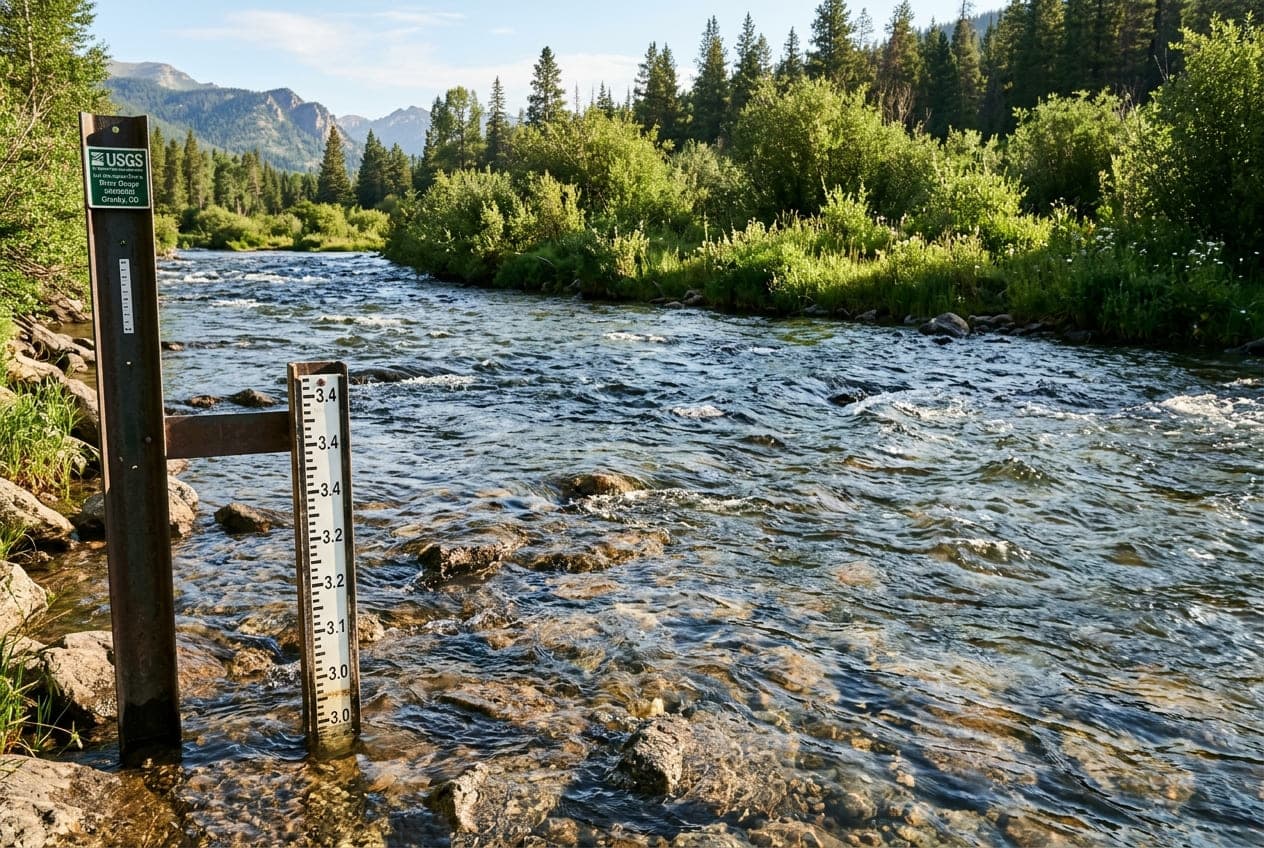
Every outdoor boater, angler, and hydrologist relies on real-time numbers published by the U.S. Geological Survey (USGS). You pull up ClearGauge, see that the river is flowing at 2,450 CFS at 5.2 feet, and plan your day.
Behind that simple number is one of the most sophisticated, century-old environmental monitoring networks on Earth.
A common misconception is that a USGS river gauge has a giant propeller or digital flow meter submerged in the middle of the river continuously calculating speed. In reality, direct continuous measurement of streamflow velocity across an entire river channel is practically impossible due to debris, floods, and shifting riverbeds.
How does the USGS determine live streamflow volume in real-time?
1. Stage vs. Discharge: The Essential Distinction
To understand stream gauging, you must understand two fundamentally different variables:
- Stage (Gauge Height in Feet): The elevation of the water surface above an arbitrary zero-datum reference point established at the station.
- Discharge (Streamflow in Cubic Feet per Second - CFS): The total physical volume of water passing through a complete cross-section of the river channel per second.
A river station measures Stage continuously. It calculates Discharge mathematically using a calibrated relationship called a Stage-Discharge Rating Curve.
2. How Stage Is Measured Continuously
The USGS operates over 11,000 real-time stream gauges across all 50 states, utilizing three primary technologies to measure water stage:
A. Traditional Stilling Wells
A vertical concrete pipe or culvert installed on the riverbank, connected to the river channel by horizontal intake pipes. Water in the stilling well rises and falls at the exact same elevation as the river, but without surface wave disturbance. A float attached to a weighted tape or digital optical shaft encoder records water elevation down to the nearest hundredth of a foot (0.01 ft).
B. Gas-Purge Bubbler Systems (Pressure Transducers)
For locations where stilling wells are impractical (canyons, steep bedrock walls), a continuous stream of dry nitrogen gas or compressed air is pushed through a small orifice line anchored to the river bottom. The pressure required to push a bubble out of the tube is directly proportional to the weight (depth) of the water column above it. Highly sensitive pressure transducers convert this pneumatic pressure into stage elevation.
C. Non-Contact Radar and Ultrasonic Sensors
Mounted directly under bridge girders or cantilevered arms overhanging the river. The sensor emits high-frequency radar waves or sound pulses toward the water surface and measures the time-of-flight reflected return signal to calculate water elevation without any physical equipment in the river current.
3. The Stage-Discharge Rating Curve
Because a gauge only measures height, hydrographers must establish how many cubic feet per second correspond to each hundredth of a foot in height.
To build this curve, USGS hydrologic technicians make physical field visits to every active station throughout the year—wading across the river, dangling from cableways, or operating remote-controlled tethered boats across high runoff.
During these visits, the hydrologist measures two things simultaneously:
- The exact stage height on the staff plate.
- The exact cross-sectional discharge across the channel.
By plotting dozens of physical measurements across drought, normal baseflow, and historic floods, hydrographers derive a mathematical logarithmic curve:
$$Q = C(h - h_0)^n$$
Where $Q$ is discharge (CFS), $h$ is stage height, and $C$, $h_0$, and $n$ are empirical hydraulic coefficients unique to that specific river channel geometry.
4. Acoustic Doppler Current Profilers (ADCP)
In past decades, hydrologists measured velocity using mechanical Price AA Current Meters (small spinning bucket wheels mounted on wading rods). Today, field calibration is performed primarily using Acoustic Doppler Current Profilers (ADCP).
How ADCP Sonar Works:
- Mounted in a small tethered hydro-catamaran, the ADCP fires multi-directional ultrasonic acoustic pulses into the water column.
- The sound waves reflect off suspended sediment particles moving with the current.
- By calculating the Doppler frequency shift of the returning echoes, the instrument computes water velocity at dozens of individual depth layers simultaneously from the surface down to the riverbed.
- Built-in GPS tracks cross-sectional channel bathymetry and width, computing total river discharge in minutes with remarkable precision (typically within ±2%).
5. Why Rating Curves Shift (Scour and Deposition)
River channels are living, dynamic hydraulic systems. A major flash flood or spring snowmelt surge transports thousands of tons of gravel, cobbles, and logs:
- Scour (Channel Deepening): High flows excavate gravel bars, causing the riverbed to drop. After scour, a stage of 5.0 feet might carry significantly more CFS than it did before the flood.
- Deposition (Sediment Accumulation): Silt and gravel settle in the pool, raising the riverbed. After deposition, a stage of 5.0 feet might carry far less CFS than expected.
When riverbeds shift, USGS hydrographers perform emergency field measurements to publish a Shift Adjustment to the rating curve, ensuring real-time numbers published on ClearGauge remain accurate.
6. Real-Time Satellite Telemetry (GOES Network)
Once stage data is logged by the station micro-controller (typically every 15 minutes):
- The station transmitter beams an encrypted radio packet upward to the NOAA Geostationary Operational Environmental Satellite (GOES) positioned in orbit 22,236 miles above the equator.
- Ground downlink antennas in Wallops Island, Virginia, receive the satellite telemetry and route it directly into the USGS National Water Information System (NWIS) database.
- Automated validation algorithms check for abnormal spikes, sensor freezes, or transmission errors.
- ClearGauge queries these public APIs every 15 minutes, compares the readings against seasonal percentiles, and publishes the real-time condition verdict on your screen.
Want to see this in action? Check real-time river conditions near you.
Explore All Rivers →