
River Streamflow Widgets: How to Embed Live USGS Flow Data on Your Website
The complete guide to embedding live river gauges, streamflow (CFS), and flow verdicts. Learn why guides and outfitters use river widgets, compare Script vs. Iframe, and follow step-by-step setup for WordPress, Webflow, and Squarespace.
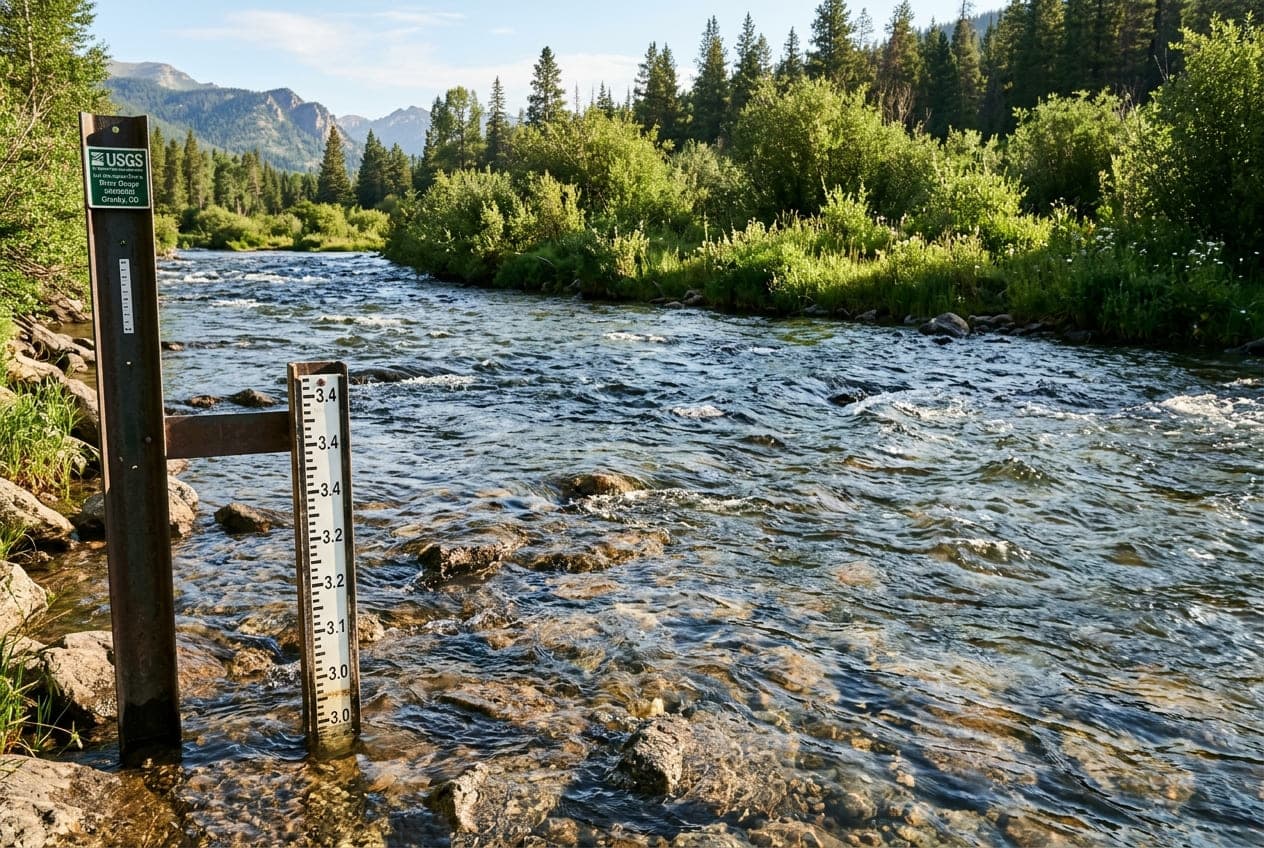
Whether you operate a fly fishing guide service, manage a whitewater rafting outfit, run an outdoor lodge, or maintain a regional river conservation blog, your visitors share one universal question before they step out the door: "What is the river running right now?"
In the past, outdoor businesses had to tell visitors to leave their website and navigate complex government databases on the U.S. Geological Survey (USGS) National Water Information System (NWIS). Today, modern river streamflow widgets let you embed auto-updating USGS gauge readings, stage levels, 7-day trendlines, and flow verdicts directly into your site with a single copy-and-paste snippet.
In this guide, we will explore why river widgets have become an essential feature for outdoor websites, the difference between Script tags and Universal iframes, step-by-step installation guides for major website builders, and a complete configuration manual for every customizable attribute.
1. Why Embed Live River Data on Your Website?
Adding a live river streamflow widget to your site delivers immediate practical value to your customers and measurable benefits to your business:
1. Slash Inbound Phone Calls and Support Emails
During seasonal runoff or summer thunderstorm season, river levels fluctuate rapidly. Outfitters and fly shops spend hours answering identical phone calls: "Is the canyon blown out?", "Are your rafts launching today?", or "Is the river too low for drift boats?".
Embedding a live gauge directly on your homepage or river report page answers these questions automatically, 24 hours a day.
2. Boost Dwell Time and Organic SEO Authority
Recreational anglers, kayakers, and rafters check river levels multiple times a week. By becoming the go-to regional source for live river telemetry, you create habitual return visits and increase on-page dwell time—a powerful positive signal for search engines.
3. Build Consumer Trust and Safety Awareness
Displaying live CFS (cubic feet per second) alongside flow verdicts (e.g., Normal Flow, High Flow, or Flood Risk) signals professionalism and prioritizes guest safety before clients arrive at your launch point.
2. Who Uses River Widgets?
River widgets are designed for any business, organization, or publication connected to flowing water:
| Industry / User | Key Use Case | What They Embed |
|---|---|---|
| Fly Fishing Guides & Lodges | Informing clients of fishable conditions, water temperature, and hatch windows. | Single River Card with 7-day discharge trendline and stage. |
| Whitewater Rafting Outfitters | Demonstrating rapid class difficulty and runnable commercial CFS brackets. | Prominent river cards on trip booking and safety policy pages. |
| Kayak & Canoe Clubs | Coordinating weekend paddling meetups and monitoring release schedules. | Multi-River Grid comparing 3 to 6 regional creeks and rivers. |
| Regional Tourism Boards & Parks | Advising public recreationists on safe swimming and boat ramp access. | Inline compact tickers in header announcements or footers. |
| Watershed & Conservation Groups | Tracking drought severity, ecological baseflows, and seasonal snowmelt runoff. | Clean transparent river widgets embedded into annual impact reports. |
3. How ClearGauge Embeds Work
Under the hood, ClearGauge Embed Widgets synchronize continuously with official USGS hydrological monitoring stations across the United States.
┌─────────────────────┐      ┌──────────────────────┐      ┌─────────────────────────┐
│  USGS Satellite &   │ ───► │ ClearGauge Hydrology │ ───► │ Your Website Visitor's  │
│ Ground Telemetry    │      │ Cache & Verdict Edge │      │ Browser (Widget / Frame)│
└─────────────────────┘      └──────────────────────┘      └─────────────────────────┘
 (Every 15-60 min)            (Rate-of-Rise & Delta)        (Sub-50ms Load Time, Zero CLS)
- Direct USGS NWIS Integration: USGS field stations measure water stage and calculate discharge every 15 to 60 minutes, transmitting data via satellite.
- Proprietary Flow Verdicts & Trend Deltas: Rather than presenting visitors with raw numbers, ClearGauge calculates the 6-hour rate of rise or drop (e.g.,
▲ +420 CFS (6h)) and provides flow status badges (Normal, High, Low, or Flood Risk). - Edge Caching for Performance: Telemetry is cached and delivered via a high-speed CDN edge layer. Your website never executes heavy client-side charting libraries like Chart.js or D3; the 7-day sparkline is delivered as a pure, lightweight vector SVG (under 1 KB).
4. Script Tag vs. Universal Iframe: Which Should You Use?
ClearGauge offers two delivery methods for embedding river data. Here is how they compare:
| Capability | Script Tag (widget.js) | Universal <iframe> |
|---|---|---|
| Recommended For | WordPress, Webflow, Ghost, custom static/dynamic sites | Wix, free Squarespace, Shopify restricted blocks, Substack |
| Font Inheritance | Yes — Automatically inherits your website's exact typeface | No — Uses clean native system typography |
| Height Sizing | Dynamic Auto-Height — Automatically resizes, zero scrollbars | Fixed height specified in HTML attributes |
| Page Weight | Ultra-light (under 2 KB shared loader script for all widgets) | Standalone sandboxed document |
| Fallback for No-JS | Graceful fallback link to live ClearGauge river report | Blank container if iframes are blocked |
| Security Isolation | Seamless DOM integration with sandboxed contents | 100% strict cross-origin sandbox |
Recommendation: In 95% of cases, use the Script Tag. It matches your typography automatically and ensures the card never gets cut off when text wraps on small mobile screens. If your publishing platform strictly prohibits custom
<script>tags, use the Universal Iframe.
5. Step-by-Step Installation Guides by Platform
WordPress (Block Editor / Gutenberg)
- In your WordPress admin, open the page or post where you want the river widget to appear.
- Click the
+(Add Block) button and search for Custom HTML. - Copy your snippet from the ClearGauge Embed Generator and paste it into the block.
- Click Preview or Update. The widget will automatically render in place.
Tip for Elementor Users: Drag an HTML widget into your column and paste your snippet into the HTML Code field.
Webflow
- In the Webflow Designer, open the Add Panel (
A) and drag an Embed element from the Components section into your container. - Paste your ClearGauge widget snippet into the HTML code editor.
- Click Save & Close, then Publish to your custom domain or staging site.
Squarespace
- In page edit mode, click Add Block and choose Code (or Embed > Code Snippet).
- Set the language dropdown to HTML and ensure Display Source is turned off.
- Paste your snippet into the code box. Squarespace will display a preview placeholder in edit mode; publish the page to view the live auto-updating widget.
Wix
- In the Wix Studio or Editor, click Add Elements (
+) > Embed Code. - Select Embed HTML (or Custom Code).
- Select the Universal Iframe format in the ClearGauge Generator and paste the
<iframe>snippet into the HTML box. - Drag the handles to position the widget in your layout and click Publish.
Shopify
- In your Shopify Theme Editor, navigate to Custom Liquid or click Add Section > Custom HTML.
- Paste your widget snippet into the code area and click Save.
6. Complete Configuration & Attribute Manual
If you are using the Script Tag (widget.js) embed, you can customize the card's behavior and aesthetics using standard HTML5 data-* attributes:
<!-- Example: Custom Transparent Dark River Card -->
<a
  class="cleargauge-widget"
  href="https://www.cleargaugerivers.com/gauge/07091200"
  data-site="07091200"
  data-label="Arkansas River - Browns Canyon"
  data-theme="transparent"
  data-text="light"
  data-accent="0d9488"
  data-radius="16"
  data-shadow="sm"
>View Live Streamflow on ClearGauge</a>
<script async src="https://www.cleargaugerivers.com/widget.js"></script>
Full Attribute Reference
| Attribute | Supported Values | Default | Description |
|---|---|---|---|
data-site | USGS Site ID (e.g., 07091200) | Required for single | The official 8- to 15-digit USGS hydrological station number. |
data-sites | Comma-separated IDs (e.g., 07091200,09380000) | Required for grid | Displays up to 6 stations in an auto-wrapping responsive grid. |
data-label | Any string (e.g., Upper Arkansas) | USGS Official Name | Overrides technical USGS station names with your custom river section name. |
data-theme | light · dark · transparent | light | Sets overall color scheme. Transparent blends directly into host page backgrounds. |
data-bg | solid · transparent | solid | Explicitly removes card background fill so the host page background shows through. |
data-text | dark · light | dark | Controls typography tone in transparent mode (use light for dark sites, dark for light sites). |
data-accent | 3- to 6-digit Hex (e.g., 0d9488, ea580c) | #0d9488 (Teal) | Color used for streamflow value, sparkline trendline, and branding highlights. |
data-radius | Integer in px: 0 · 8 · 12 · 20 | 12 | Controls corner curvature: Sharp (0), Rounded (8), Default (12), Pill (20). |
data-border | none | Subtle 1px stroke | Set to none to remove the outline stroke around the card. |
data-shadow | none · sm · md | none | Adds a soft (sm) or lifted (md) drop shadow under the widget card. |
data-format | card · compact | card | card renders full telemetry & sparkline. compact renders a minimal horizontal banner. |
data-layout | detailed · simple | detailed | For multi-river grids: detailed shows full cards; simple shows compact ticker rows. |
data-chart | spark · none | spark | Toggle the 7-day vector sparkline graph on or off. |
7. Privacy, Compliance, and Core Web Vitals
When choosing a third-party widget for your website, performance and data privacy are paramount:
Zero Visitor Tracking (100% GDPR & CCPA Compliant)
ClearGauge widgets do not set cookies, do not store local storage tokens, and do not execute third-party advertising or fingerprinting trackers. Infrastructure servers only inspect the standard HTTP Referer hostname to calculate aggregate domain request totals. Your visitors remain completely anonymous.
Core Web Vitals Friendly
- Zero Cumulative Layout Shift (CLS): Initial dimensions and transition heights are pre-allocated to prevent content jumping as pages load.
- Native Lazy Loading: All widgets carry
loading="lazy"to ensure off-screen widgets below the fold do not delay initial page render. - Sub-50ms Render Time: Vector SVG charts avoid heavy JavaScript chart dependencies.
USGS Data Attribution
USGS streamflow telemetry is in the U.S. public domain. In accordance with USGS policy, all real-time readings are identified as provisional data, and each card includes a verified, highlighted link to the official station record on waterdata.usgs.gov.
8. Generate Your Custom River Widget
Ready to add live streamflow telemetry to your website? Use our free visual generator tool to pick your rivers, customize brand colors, and copy your snippet in under a minute:
Want to see this in action? Check real-time river conditions near you.
Explore All Rivers →