
River Water Clarity and Turbidity: How Flow Spikes, Runoff & Mud Affect Visibility
Understand river turbidity, how USGS turbidity sensors and Secchi depth work, why rivers blow out after storms, and clearing curves for anglers and paddlers.
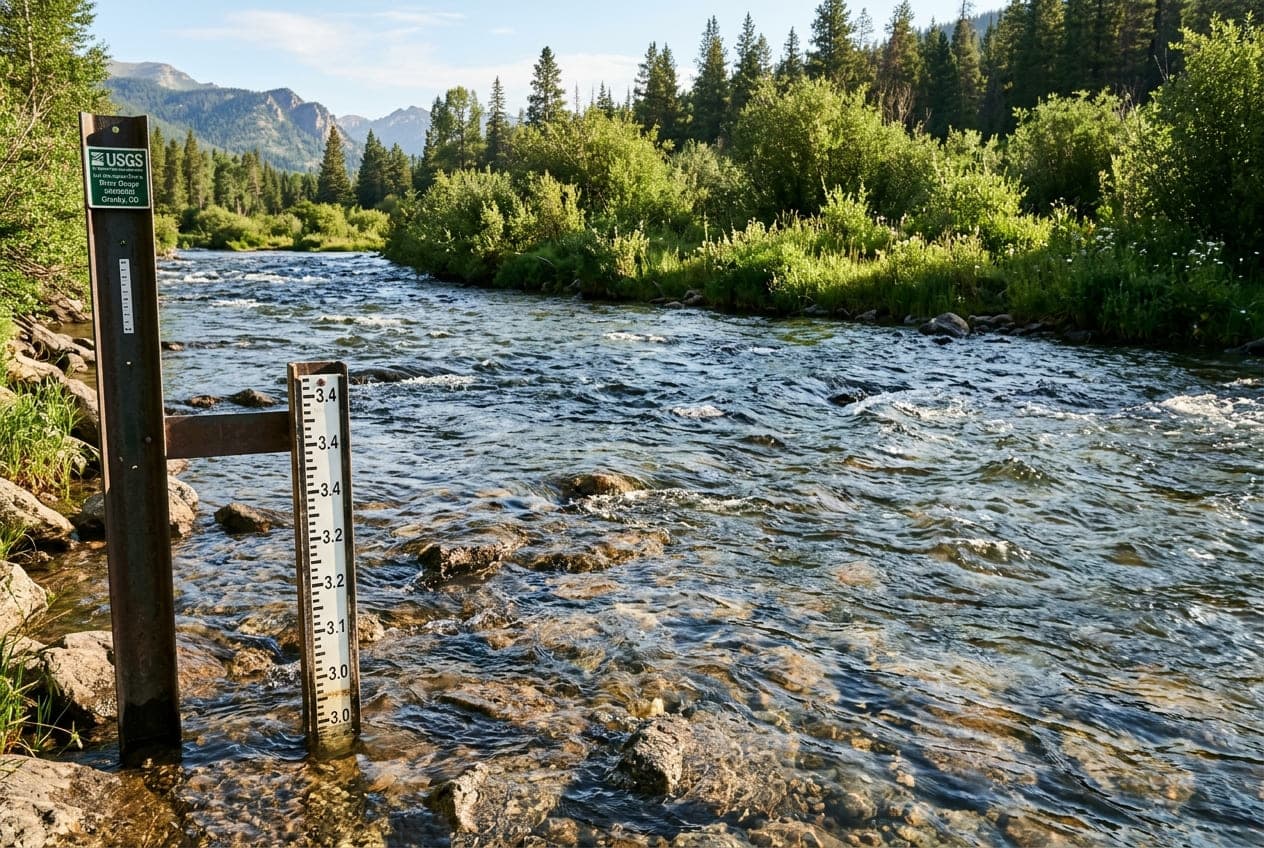
Ask any fly angler, kayaker, or river guide what the first question they ask on a Saturday morning is, and you will almost certainly hear: "Is the water clear, or is the river blown out?"
While checking live discharge (CFS) and gauge stage tells you how much water is moving, flow volume alone does not tell the full story. A river running at 1,500 CFS could be gin-clear, emerald-green, or the color of thick chocolate milk depending on recent rainfall distribution, soil type, and watershed geology.
Water clarity—scientifically quantified as turbidity—governs everything from predatory fish sight-feeding behavior to underwater hazard visibility for paddlers. Here is an in-depth hydrological guide to understanding river turbidity, how it correlates with streamflow hydrographs, and how to predict water visibility before driving to the boat ramp.
What is Turbidity? The Science of Murky Water
In hydrology and aquatic ecology, turbidity is an optical measurement of water clarity. It describes the degree to which light is scattered and absorbed by suspended solid particles rather than transmitted in straight lines.
These suspended particles include:
- Inorganic mineral sediment: Fine clays, silts, and eroded riverbank soils.
- Organic detritus: Decomposed leaf litter, decaying plant matter, and dissolved humic acids.
- Biological organisms: Microscopic algae blooms and phytoplankton.
How Turbidity is Measured
- NTU (Nephelometric Turbidity Units) & FNU (Formazin Nephelometric Units): Modern digital water-quality sensors shine an infrared or white light beam through a water sample and measure the light scattered at a 90-degree angle. Clear mountain tap water is under 1 NTU, while a raging mud torrent can exceed 1,000 NTU.
- Secchi Depth: A traditional field metric used by limnologists and river watchers. An 8-inch alternating black-and-white disc is lowered into the water on a calibrated line until it disappears from sight. The depth of disappearance is the Secchi depth.
The Water Clarity Matrix: Classifying River Conditions
Different outdoor activities require different levels of water transparency. Here is how hydrological clarity tiers break down:
| Clarity Tier | Typical NTU Range | Visual Secchi Depth | Water Appearance | Outdoor & Fishing Implications |
|---|---|---|---|---|
| Gin Clear | < 5 NTU | 6+ feet (bottom visible) | Crystal clear, transparent; pebbles sharp at depth | Spooky Fish / Clear Sightlines: Fish have maximum visual acuity and detect leader tippet easily. Paddlers can easily spot submerged rocks and ledges. |
| Emerald / Tea Stained | 5 – 25 NTU | 2 to 5 feet | Rich greenish tint, or amber tea color from dissolved forest tannins | The Golden Window: Prime conditions for trout and bass. Provides overhead camouflage from predatory birds while maintaining enough visibility for aggressive sight feeding. |
| Stained / Off-Color | 25 – 80 NTU | 12 to 24 inches | Cloudy olive or khaki; boots vanish at mid-calf | Transition Stage: Sight-hunting gamefish hug bank edges and slow structure. Anglers switch to dark silhouettes, large streamers, or vibrating spinnerbaits. |
| Blown Out / Muddy | > 100+ NTU | Under 6 inches | Opaque brown "chocolate milk"; floating logs and debris | Severely Impaired: Fish stop feeding visually and rely strictly on lateral line vibrations. Boaters cannot see submerged boulders or foot-traps. Trip cancellation advised. |
The Clearing Curve: Hydrograph Peaks vs. Sediment Peaks
One of the most valuable hydrological skills for any river recreationist is reading the clearing curve on a USGS hydrograph.
When a heavy storm system dumps 2 inches of rain over a watershed:
- The Rising Limb (Mud Arrives First): Rain initially hits bare topsoil, agricultural fields, dirt roads, and dry gullies. This surface runoff washes fine sediment into feeder creeks hours before the river's main volume crests. Turbidity spikes steeply on the front side of the hydrograph.
- The Crest (Peak Discharge): The river hits its maximum gauge height and CFS. The water is churning, turbid, and dangerous.
- The Falling Limb (The Clearing Phase): Once the rain stops, surface runoff dries up. The river is now fed predominantly by clean subsurface groundwater seepage and dam reservoir discharge.
Hydrological Secret: The water almost always clears up while the river is still running high. An experienced angler or boater watches for the crest: within 12 to 36 hours of the peak, the river often drops from chocolate brown to that coveted deep emerald-green, even while discharge numbers remain well above seasonal averages.
Watershed Geology: Why Some Rivers Clear in Hours and Others Take Weeks
Have you ever wondered why two rivers just 50 miles apart react totally differently to the same rainstorm? The answer lies in the bedrock and land use of the watershed:
1. Freestone Granitic Mountain Basins (e.g., Rocky Mountains, Sierra Nevada)
Mountain rivers that tumble over solid granite bedrock, clean cobble, and coarse gravel have very little fine clay. When heavy rains fall, the river may surge violently, but because the sediment is coarse sand and gravel, it drops out of suspension rapidly. These rivers can return to fishable clarity within 18 to 24 hours after a storm.
2. Agricultural & Clay Valley Watersheds (e.g., Midwest, Piedmont, Ozarks)
Rivers flowing through fertile agricultural floodplains or areas with fine red clay or loess soil take days or weeks to clear. Colloidal clay particles are so microscopic (under 0.002 mm) that Brownian motion keeps them suspended in the water column indefinitely, even in near-stagnant pools.
3. Tailwaters Below Bottom-Release Dams
Rivers located directly downstream of major reservoirs (like the San Juan in New Mexico or the White River in Arkansas) remain remarkably clear even during seasonal storms. Deep reservoirs act as massive settling basins; sediment drops to the lake floor, allowing the dam to release chilled, crystal-clear water downstream regardless of weather.
How the USGS Monitors Real-Time Turbidity
While every USGS streamgage reports water height and flow, select high-priority monitoring stations also feature continuous water-quality parameter instrumentation:
- In-Situ Optical Sensors: Submerged sensor heads emit pulsed infrared light (860 nm) and record optical backscatter every 15 minutes.
- Automated Wiper Blades: Because algae and river biofilms quickly coat underwater glass lenses, modern USGS sensors utilize automated mechanical wiper arms that clean the optical lens prior to every transmission.
- Sediment Surrogacy Models: Hydrologists use live turbidity readings to calculate the total tons of suspended sediment entering drinking water reservoirs, municipal intakes, and estuary spawning beds.
Strategies for Anglers and Boaters When Rivers Are Off-Color
If you arrive at the river and find stained or murky conditions, adapt your strategy using these hydrological principles:
- Target the Tributary Confluences: Look on satellite maps for smaller, spring-fed or forested feeder creeks entering the muddy mainstem. These "clear water plumes" attract baitfish and feeding predators looking for refuge from turbid main-river silt.
- Fish the Soft Edges: High turbidity severely restricts light penetration to the upper 12 inches of the water column. Fish migrate out of deep holes and position themselves within inches of the grassy shoreline, shallow eddies, and boulder edges.
- Contrast Over Color: In stained water, bright neon lures wash out into fuzzy gray blobs. Instead, use high-contrast black, dark purple, and copper colors that create distinct silhouette outlines against the cloudy background.
Track River Clarity Trends on ClearGauge
Before spending time and money traveling to your favorite river, monitor recent hydrograph curves.
Check live state-by-state streamgages and historical hydrographs on ClearGauge to see whether your target river has crested and started its downward clearing trend. Knowing the numbers before you hit the water saves trips and guarantees better days outdoors!
Want to see this in action? Check real-time river conditions near you.
Explore All Rivers →